This article guides reading
With the development of power modules, engineers have focused on how to make modules smaller and lighter. In fact, we all understand that we can increase the power density of products by increasing the switching frequency. But why has the module's volume so far not changed so much? What restricts the increase of switching frequency?With the application of switching power supply products under the market, increasingly smaller, lighter, high-efficiency, low-radiation, low-cost and other characteristics are required to satisfy various electronic terminal equipments. In order to meet the current portable electronic terminal equipment, the switching power supply must be made small in size. Due to its light weight, it has become a matter of increasing concern for designers to increase the operating frequency of switching power supplies. However, what are the factors limiting the frequency of switching power supplies? In fact, it mainly includes three aspects: switch tubes, transformers, and EMI and PCB design.
A, switch tube and switching frequency
Switching tube as the core device of the switching power supply module, its switching speed and switching loss directly affect the limit of the switching frequency, the following for everyone to analyze.
1, the switching speed
The loss of the MOS transistor consists of switching losses and drive losses, as shown in Figure 1: turn-on delay time td(on), rise time tr, turn-off delay time td(off), and fall time tf.
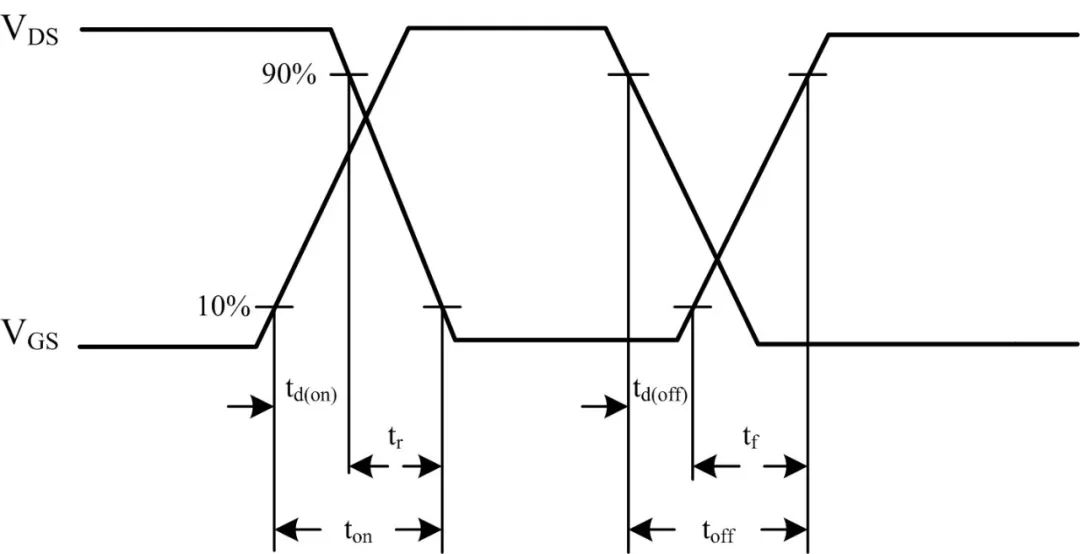
Figure 1 MOS switch diagram
Taking MOS from FAIRCHILD as an example, as shown in Figure 2: FDD8880 switching time characteristics table.

Figure 2 FDD8880 switching time characteristics table
For this MOSFET, its limit switching frequency is: fs=1/(td(on)+tr+td(off)+tf) Hz=1/(8ns+91ns+38ns+32ns)=5.9MHz, in practice In the design, since the duty cycle of the control switch achieves voltage regulation, the on and off of the switch tube cannot be instantaneously completed. That is, the actual limit switching frequency of the switch is much less than 5.9 MHz, so the switching speed of the switch tube itself limits the increase of the switching frequency. .
2, switching loss
When the switch is turned on, the corresponding waveform is shown in Fig. 3(A). When the switch is turned off, the corresponding waveform is shown in Fig. 3(B). It can be seen that the switch's VDS voltage and flow through the switch tube each time the switch turns on and off. The current ID has overlapping time (shaded position in the figure), resulting in loss P1, then the total loss PS = P1 *fs in the operating state of the switching frequency fs, that is, the number of times the switch is turned on and off when the switching frequency is increased. The more losses, the greater the loss, as shown in Figure 3 below.
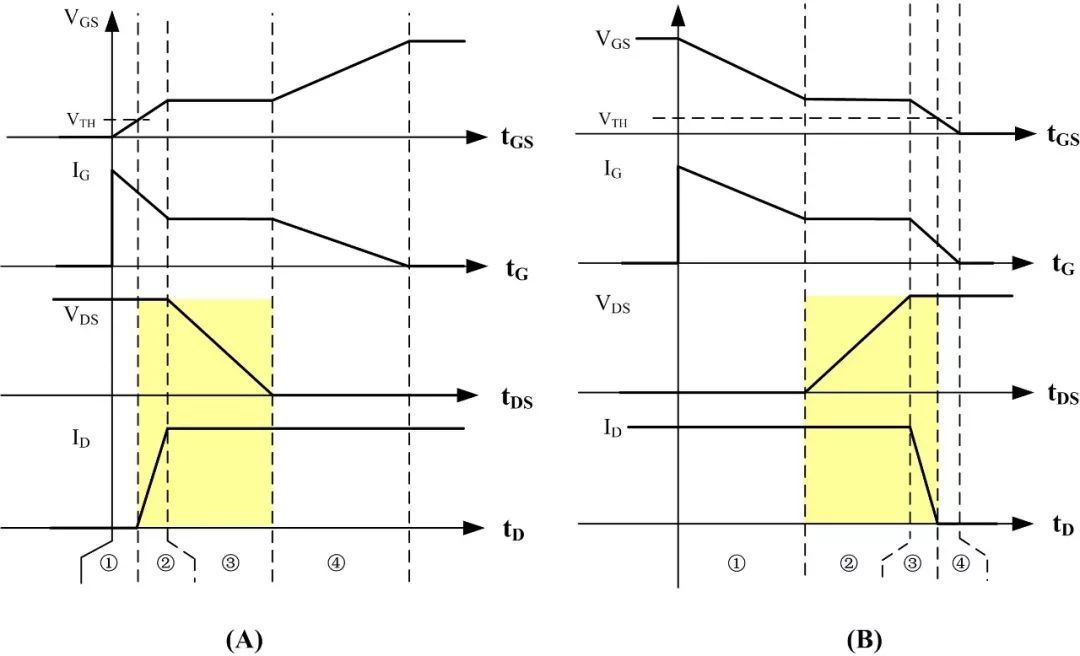
Figure 3 Switching tube loss diagram
Second, transformer iron loss and switching frequency
The iron loss of the transformer is mainly caused by the eddy current loss of the transformer, as shown in Fig. 4.
When a high-frequency current is applied to the coil, a changing magnetic field is generated inside and outside the conductor perpendicular to the current direction (1→2→3 and 4→5→6 in the figure). According to the law of electromagnetic induction, a changing magnetic field generates an induced electromotive force inside the conductor. This electromotive force generates eddy currents in the entire length direction (L face and N face) of the conductor (a→b→c→a and d→e→f→d). ,The main current and eddy current are strengthened on the surface of the conductor, and the current tends to the surface. Then, the effective AC cross-sectional area of ​​the conductor decreases, resulting in an increase in the AC resistance (eddy current loss factor) of the conductor and an increase in loss.
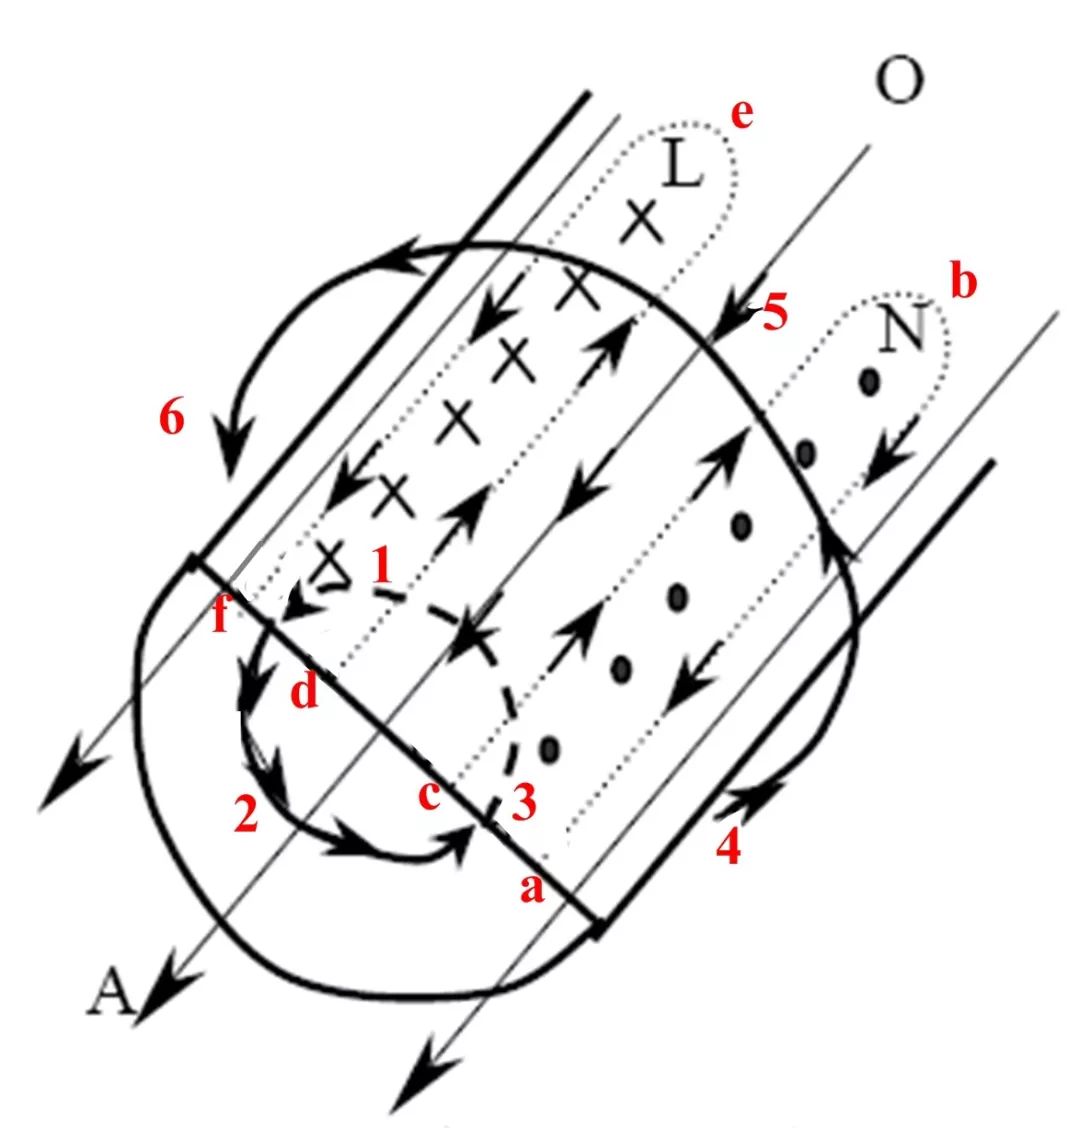
Fig. 4 Schematic diagram of transformer eddy current
As shown in Fig. 5, the transformer core loss is proportional to the kf power of the switching frequency, and is related to the limitation of the magnetic temperature. Therefore, as the switching frequency increases, high-frequency currents flow in the coil and cause severe high-frequency effects. As a result, the conversion efficiency of the transformer is reduced, resulting in a rise in the temperature of the transformer, thereby limiting the increase in the switching frequency.
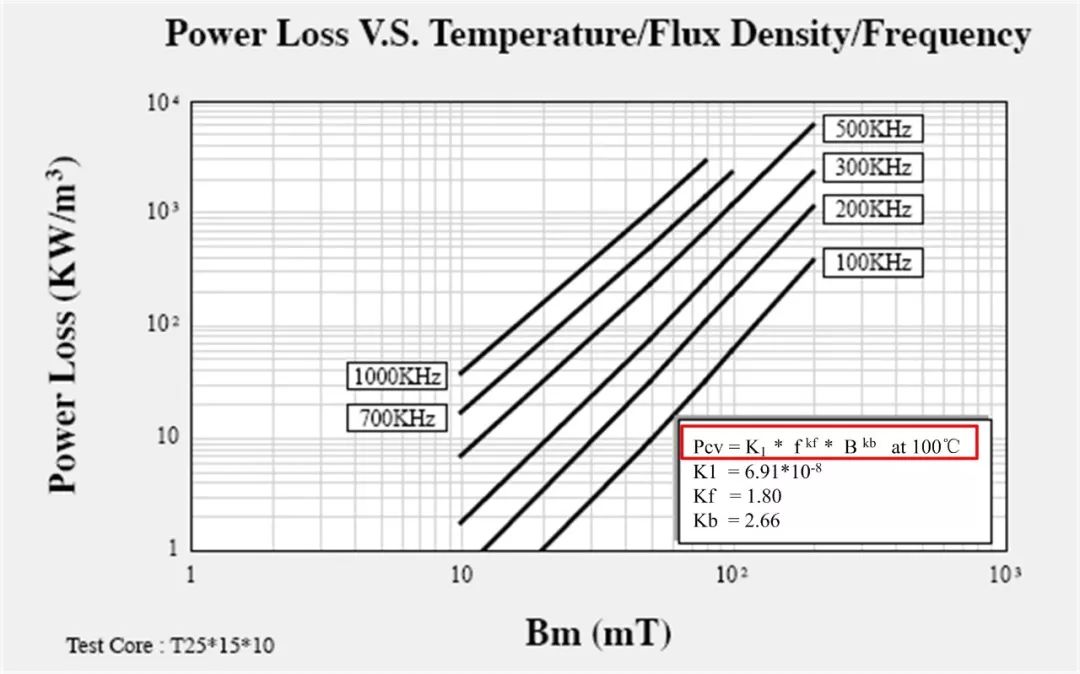
Figure 5 Transformer core loss and switching frequency diagram
Third, EMI and PCB design and switching frequency
Assuming that the above power device losses are solved, truly high frequencies still need to solve a series of engineering problems because at high frequencies, inductors are no longer the inductors we are familiar with, and capacitors are not our known capacitors. All parasitic parameters It will produce corresponding parasitic effects, which will seriously affect the performance of the power supply. For example, the parasitic capacitance of the primary side of the transformer, the leakage inductance of the transformer, the parasitic inductance and parasitic capacitance between the PCB layouts will cause a series of voltage and current waveform oscillations and EMI problems. The voltage stress of the switch is also a test.
Fourth, summary
To increase the power density of switching power supply products, the first consideration is to increase the switching frequency, which can effectively reduce the size of transformers, filter inductors, and capacitors. However, it is caused by the loss caused by the switching frequency, which makes it difficult to design the thermal rise. The increase in frequency will also lead to a series of engineering problems such as driving and EMI.
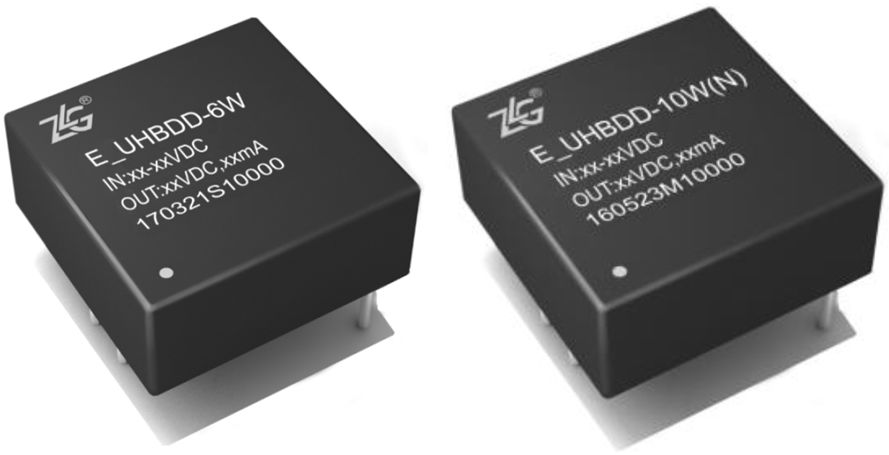
ZLG Zhiyuan Electronics has independent research and development, production of isolated power module has been accumulated in the industry for nearly 20 years, currently using a new program to achieve the same type of product, the smallest volume, such as E_UHBDD-10W module compared to the previous generation ZY_UHBD-10W volume reduced by half, as follows Figure 6 shows.
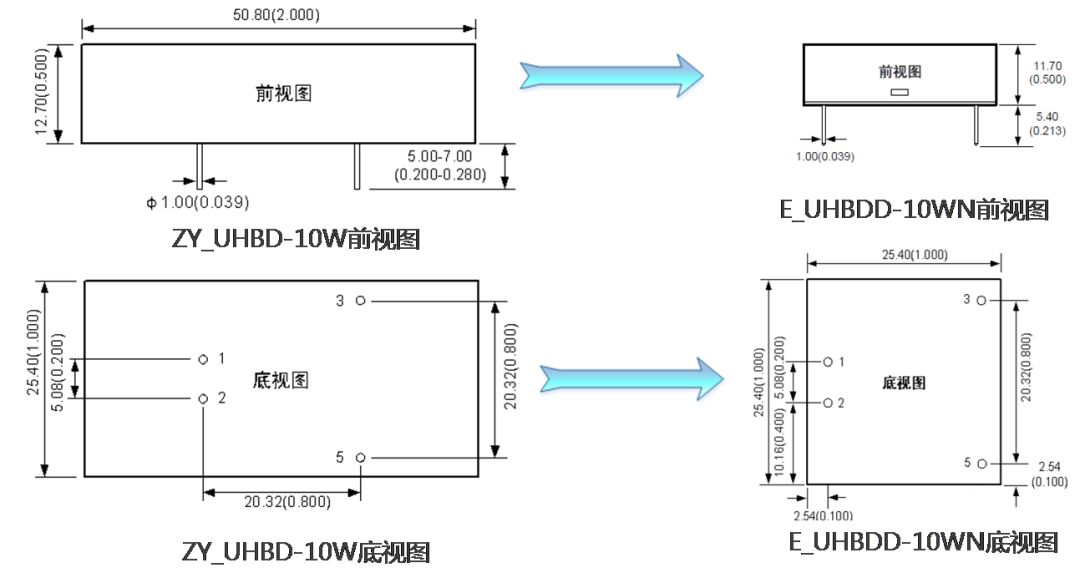
Fig. 6 Comparison of E_UHBDD-10WN and ZY_UHBD-10W specifications
At the same time, ZLG Zhiyuan Electronics has built a first-class testing laboratory in the industry to ensure the performance of power products, equipped with the most advanced and complete testing equipment, and a full range of isolated DC-DC power supplies passed complete EMC testing, with electrostatic immunity up to 4KV and surge. Immunity up to 2KV, can be applied to most of the complex and harsh industrial sites, to provide users with stable and reliable power isolation solutions.
12.8V100Ah Lithium Iron Phosphate Battery
Saintish lithium iron batteries use top quality cells, which are auto grade A LiFePO4 cells with higher energy density, more stable performance . UL approved for the cells inside the battery.
The lithium-ion batteries are perfect for solar system, caravan, RVs, campers, Yacht, off-grid applications and lead aicd replacement.
Saintish Lithium Iron Phosphate Battery provides 3000+ cycles (@100%DoD) and 10 years lifespan. which is 10 times than lead-acid battery.
1/3 of the weight of lead acid, Saintish LiFePO4 Battery weighs only 11.8kgs each pc, but delivers twice power.
Saintish lithium iron phosphate battery has built-in BMS to protect it from overcharge, over-discharge, over current, and short circuit with excellent self-discharge rate. Operating Temperature: Charge: 0°C~45°C; Discharge: -20°C~60°C.
SPECIFICATIONS
|
Rated Capacity |
100Ah |
Charge Temperature |
0-45℃ |
|
Nominal Voltage |
12.8V |
Connection Method |
Parallel & Series |
|
Energy |
1280Wh |
Dimensions |
330*172*223mm |
|
Battery Cycle Life |
>3000@100% DOD |
Weight |
11.8KGS |
|
Maximum Charging Current |
50A |
Terminal Torque |
12-15N.m |
|
Maximum Continuous Discharging Current |
100A |
Enclosure Protection |
IP65 |
|
Discharging Voltage Range |
8.4-15.2V |
Max. Batteries in Series |
4 |
|
Charging Voltage Range |
14.4-15.2V |
Certifications |
CE, UN38.3, MSDS |
|
Discharge Temperature |
-20-60℃ |
Warranty |
5 Years |
Lithium Batteries, Solar Battery, 100Ah Battery
Hangzhou Saintish Technology Co.,Ltd. , https://www.saintishtech.com