At present, the commonly used signal analyzer (VSA) measurement method is performed by using a standard vector signal source. The advantage is that it is simple and convenient to operate, and the disadvantage is that the accuracy, stability and repeatability of the "standard source" cannot be guaranteed.
International metrology institutions, such as Germany PTB, UK NPL, and US NIST, use high-speed sampling oscilloscopes and multi-carrier signal sources to synchronize time and phase and perform system calibration through synchronous triggering devices. The sample values ​​of the oscilloscope are calculated by software programs. As a reference to the amplitude phase parameter, metering calibration of the signal analyzer parameters is achieved.
The advantage of multi-carrier signal source + oscilloscope + synchronizer is to trace the vector parameters to the power level, time and frequency. The disadvantage is that the oscilloscope frequency range is limited, the uncertainty is large, and the synchronization delay brings a large amount in the microwave measurement. The phase error, the system is complex, introduces more uncertainty.
2. The calibration technique proposed in this paperIn this paper, the continuous wave frequency offset method is used to measure the residual error of the signal analyzer. Based on this method, the measurement accuracy of the analog modulation measurement signal analyzer is added.
a. Continuous wave frequency offset method: carrier frequency error, power error, vector signal analysis residual error of the signal analyzer (characterizes the noise floor of the signal analyzer to demodulate various indicators);
b. Continuous wave frequency offset additional analog modulation method: vector signal analyzer error vector magnitude EVM, amplitude error and phase error magnitude accuracy calibration and verification
c. Multi-carrier method: calibration and verification of the magnitude accuracy of the I/Q offset (carrier leakage) of the vector signal analyzer
3. Quantitative definition 3.1. I/Q signalVector is a graphical tool that uses a rotating arrow to describe a signal in a Cartesian coordinate system. The length of the arrow represents the peak amplitude of the signal. The angle between the arrow and the positive half of the horizontal axis is phase. The arrow rotates counterclockwise to the positive direction. The number of turns of the clock is the frequency.
The signal is vector-decomposed into two components with the same peak amplitude and the same frequency but 90 degrees out of phase. Usually a cosine signal and a sinusoidal signal are used to describe the two signals. The cosine component is the in-phase component I, and the sinusoid component is the quadrature component Q.
3.2. Error Vector Magnitude (EVM)The error vector (EV) is the vector difference between the actual measured signal (m) and the ideal error-free reference signal (R). The error vector magnitude is usually expressed as a percentage of the amplitude of the reference signal.
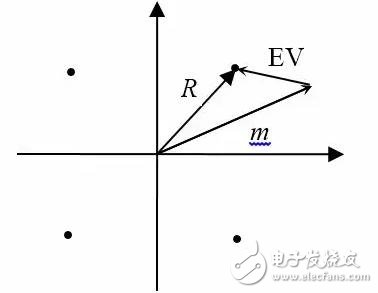
The difference between the actual measured signal (m) and the ideal error-free reference signal (R). The amplitude error is usually expressed as a percentage of the amplitude of the reference signal.
3.4. Phase errorThe phase difference between the actual measured signal (m) and the ideal error-free reference signal (R).
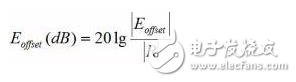
3.5. Origin offsetThe magnitude of the vector difference between the actual measured signal origin and the ideal error-free reference signal origin. It is usually expressed as the ratio (dB) to the amplitude of the reference signal.
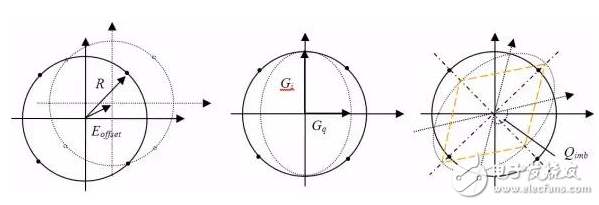
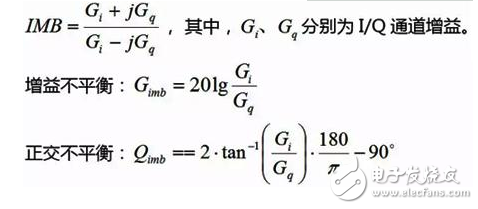
I/Q imbalances include amplitude (gain) imbalance and phase (orthogonal) imbalance.
The actual measured signal frequency is different from the ideal error-free reference signal frequency.
3.8. Average powerThe average power of the actual measured signal.
4. Continuous wave frequency offset method (CWO) 4.1. Scope of applicationThis method is used to measure and evaluate the residual intrinsic error (VSA noise) of the demodulation analysis parameters of the vector signal analyzer.
Applicable to the following digital modulation methods: MSK, PSK, QAM;
Metering calibration for the following parameters of the spectrum and vector signal analyzer:
Frequency error, power level error, residual EVM, residual amplitude error, residual phase error, I/Q origin offset (carrier leakage), residual I/Q imbalance, residual gain imbalance, residual phase imbalance
4.2. Metering and calibration equipmentThe metrology and calibration equipment is an RF microwave signal generator with a suitable frequency range. The standard parameters for traceability are frequency and power.
4.3. Principle of Continuous Wave Frequency Offset (CWO)The goal is to generate a calibration signal that corresponds to the vector signal analyzer (VSA) response digital demodulation standard constellation point, or a portion of the constellation points. According to the I/Q vector demodulation principle, an accurate I/Q vector diagram and constellation points are obtained by setting the I/Q phase difference corresponding to the VSA center frequency difference between the calibration signal.
The digital modulation methods MSK, PSK and QAM are analyzed. It is found that the vector constellation diagram contains N symmetry constellation points with the same origin. The constellation points have the same amplitude. We call these constellation points the target constellation points.
The calibration signal generated by the signal generator traced by frequency and power level, that is, the RF signal input to the VSA is a continuous sine wave whose frequency has a frequency difference Δf with the center frequency of the VSA.
Fiber Optic Splice Closure,Fiber Optic Splice Case,Fiber Splice Closures,Outdoor Fiber Optic Splice Closure
Cixi Dani Plastic Products Co.,Ltd , https://www.danifiberoptic.com